Web 3DNA 2.0 for the analysis, visualization, and modeling of 3D nucleic acid structures |
You will be automatically redirected to the new wDSSR Server in 9 seconds.
Tutorials
| Analysis | Visualization | Rebuilding | Composite | Fiber | Mutation |
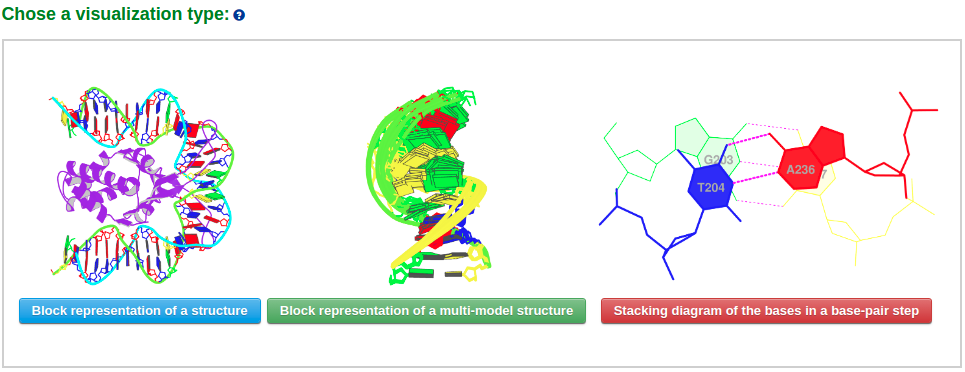
The visualization component of Web 3DNA 2.0 creates schematics images of molecular presentations. The server takes a PDB/NDB ID or a user-uploaded PDB-formatted file, and returns various representations of the structure or parts of it. In this component, three visualization styles are provided: 1) Schematic base block representation of a structure, 2) Block representation of a multi-model structure, and 3) Stacking diagram of the bases in a base-pair step.
Example 2-1: Block representation of a structure
This module generates composite block/ribbon/backbone representations of a single nucleic-acid-containing structure. The plotted image includes informative color-coding of the nucleic acid. The bases are color-coded by residue type following the NDB convention (C, yellow; G, green; A, red; T, blue; U, cyan). Minor-groove edges of the base pairs are shaded.
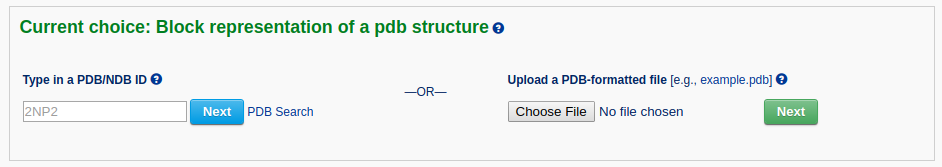
After a file is provided (for example "2NP2") and the 'Next' button is clicked, the structure will be analyzed and the user will be directed to an intermediate page, where various questions will be asked depending on the nature of the structure.
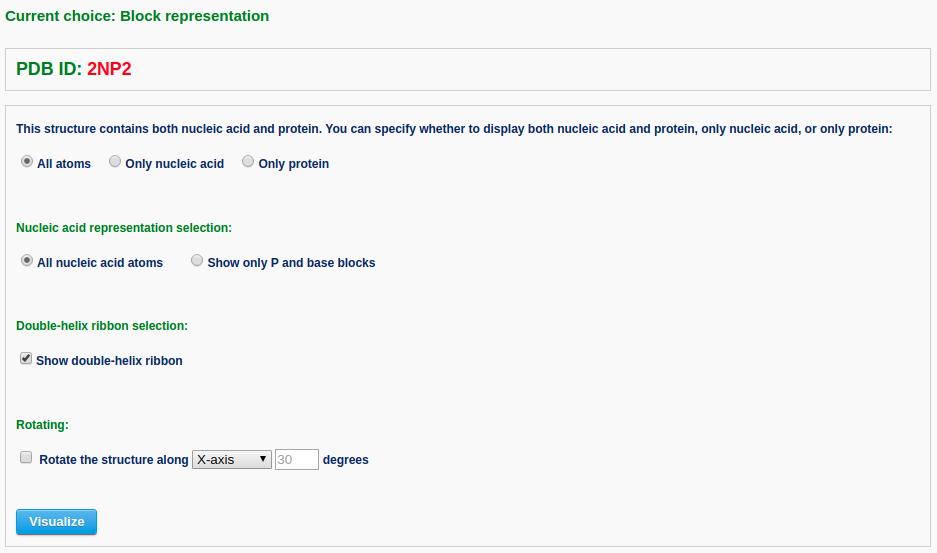
In this page, the user has multiple options to customize the resulting schematic images: 1) whether to display both nucleic acid and protein, if protein is present, or only nucleic acid, or only protein; 2) whether to show only P and base blocks for the nucleic acid structure; 3) whether to show a double-helix ribbon along the nucleic acid structure; and 4) whether to rotate the structure as a whole. The default block view places the structure in a 'best-view' orientation, i.e. the DNA structure is shown in a view perpendicular to the shortest principal axis. The user can specify an arbitrary rotation about the X-, Y-, or Z-axis.
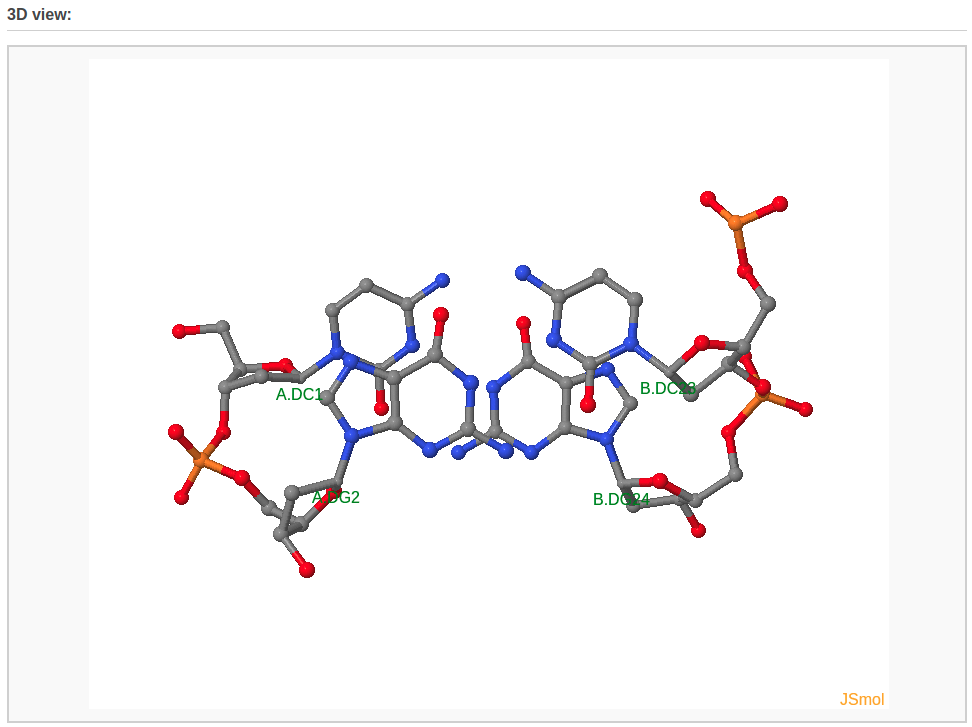
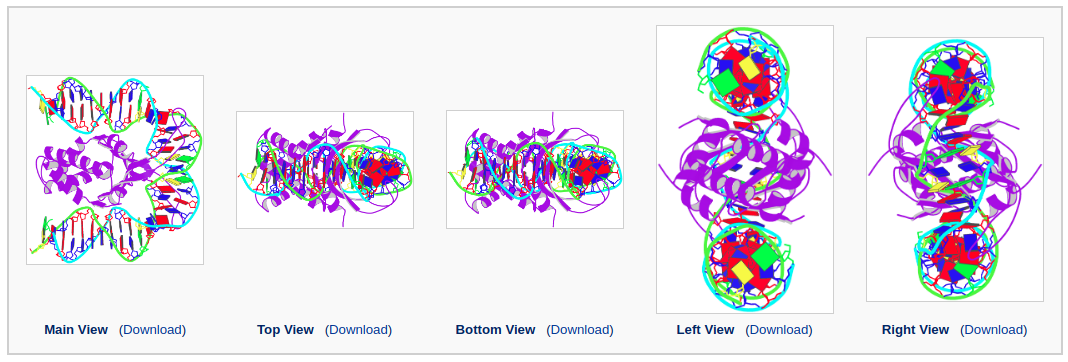
After clicking the 'Visualize' button, the user is directed to five generated images with downloadable links.
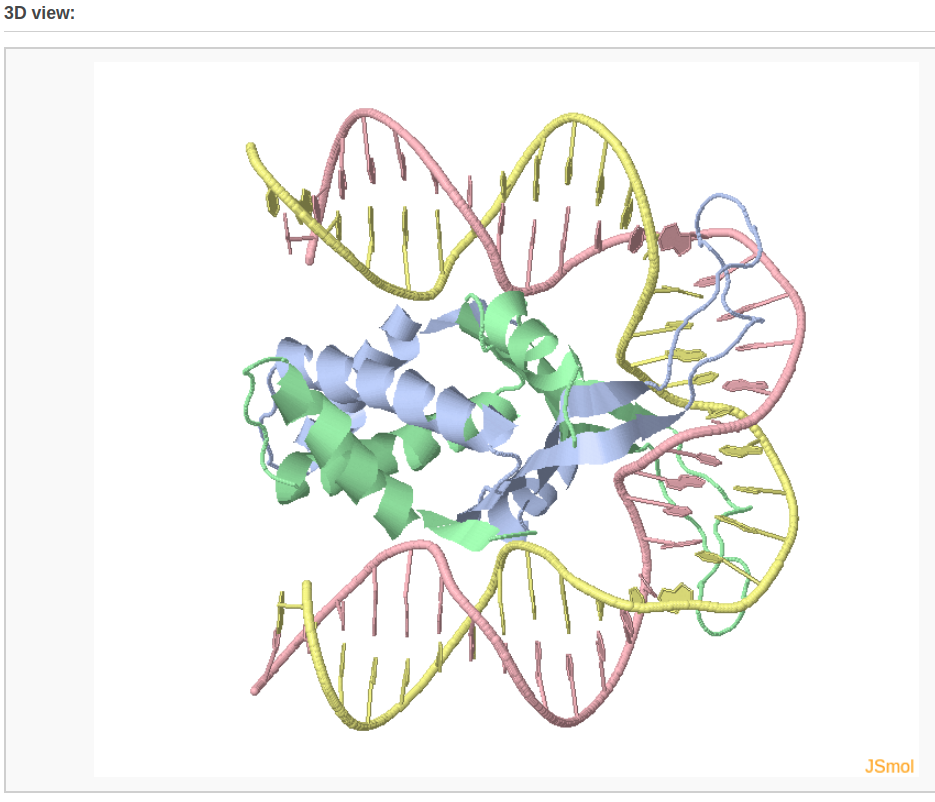
A 3D interactive visualization of the input structure is also shown.
Example 2-2: Block representation of an ensemble of structures
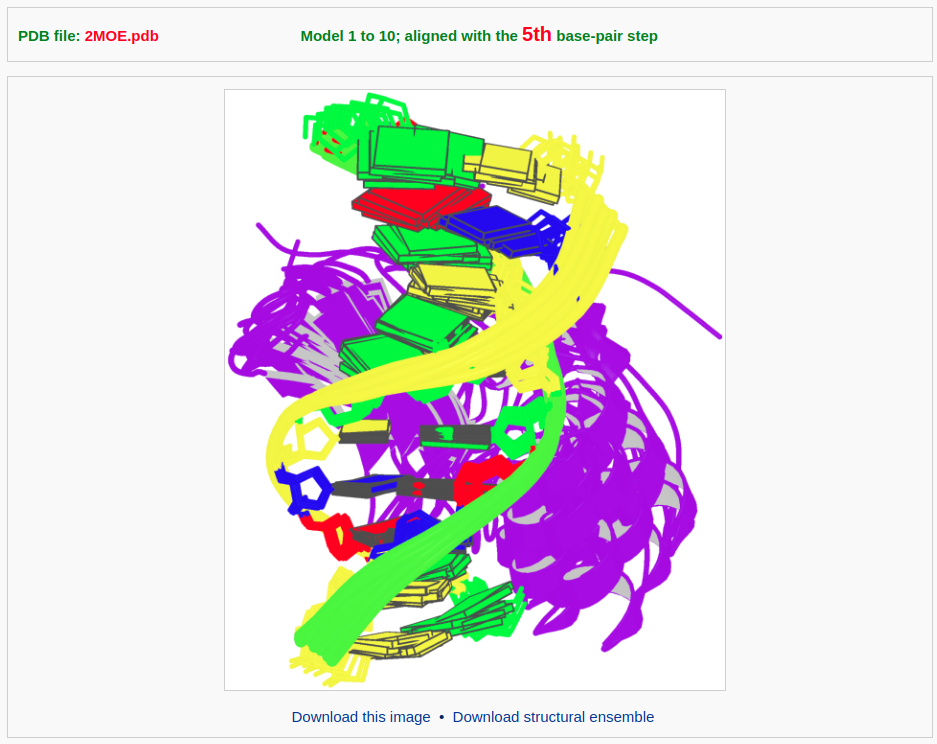
The ensemble visualization style creates a composite image for a multi-model structure, such as NMR or simulation-generated structures.
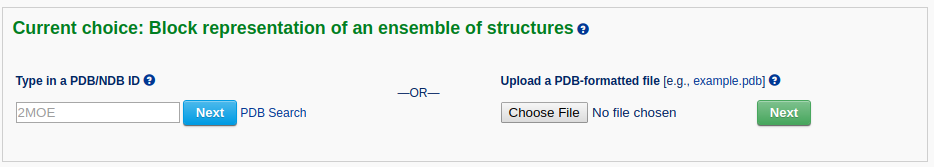
After a file is provided (for example "2MOE") and the 'Next' button is clicked, the structure will be analyzed and the user will be directed to a control page with the following options: 1) specify an ensemble of models by choosing the starting and ending models, 2) choose a specific base pair from the first model against which all other models will be aligned, or use the original alignment, and 3) indicate whether to display both nucleic acid and protein, if protein is present, or only nucleic acid, or only protein.
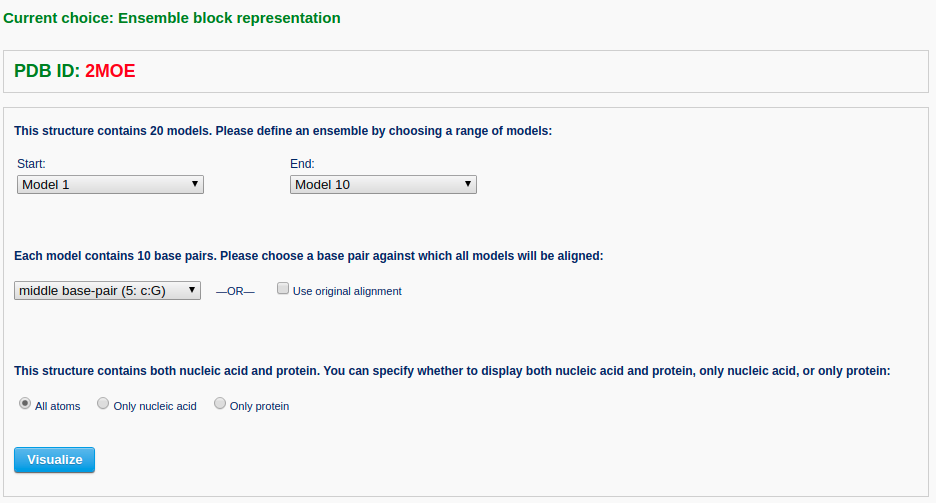
Then the user can click the 'Visualize' button to view the ensemble image and to download the coordinates of the aligned structures.
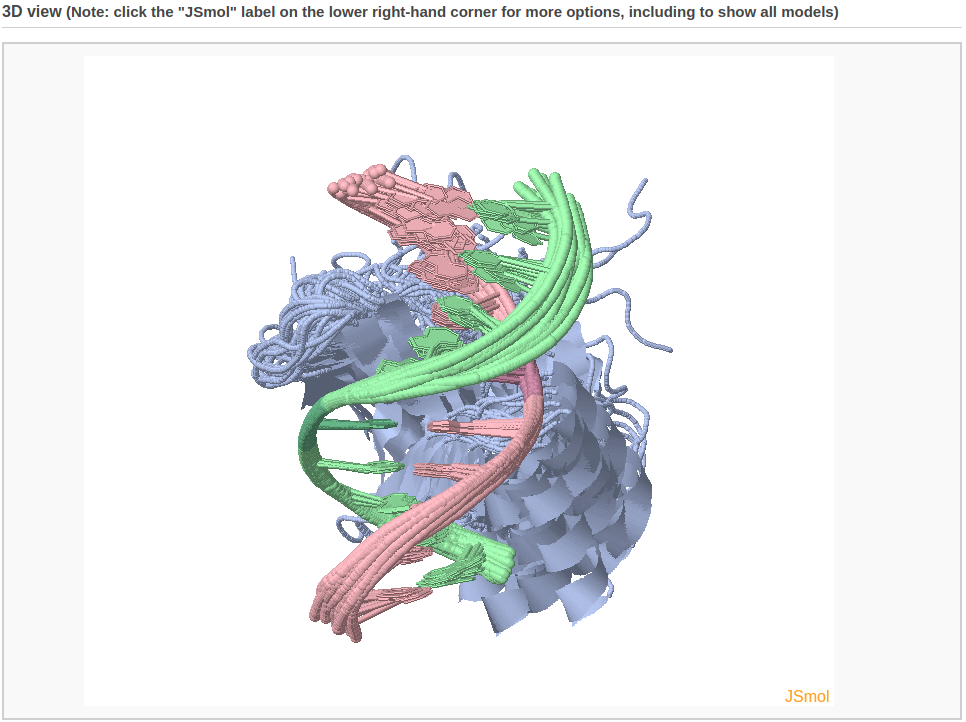
The user can also display all of the models in the 3D interactive view (after clicking the "JSmol" label on the lower right-hand corner and selecting "model 1/20" and "All").
It should be noted that this module applies only to multi-model structures; otherwise error messages will appear.
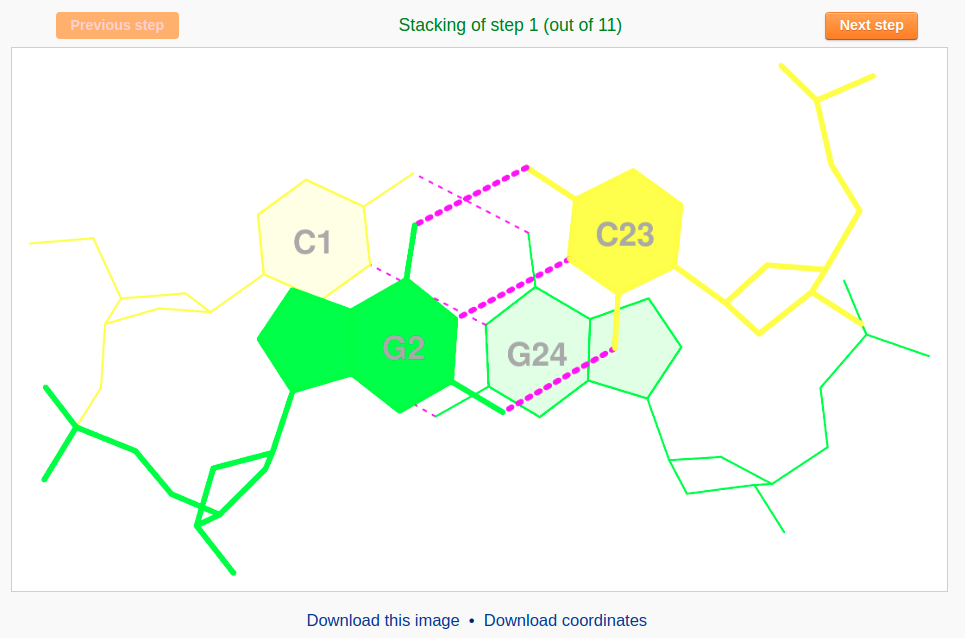
Example 2-3: Stacking diagram of base-pair steps
The 'stacking diagram' component generates images of successive Watson-Crick base pairs in a nucleic-acid-containing structure. The images are plotted with H-bonds and filled base rings; the user has the option to label the bases.
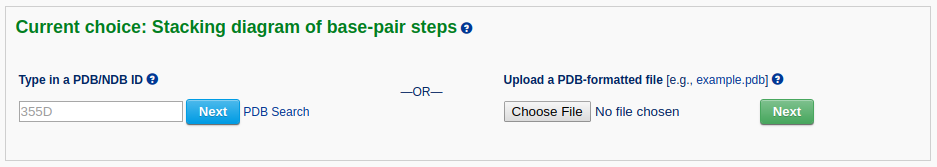
After a file is provided (for example "355D") and the 'Next' button is clicked, the structure will be analyzed and the user will be directed to an intermediate page to choose a base-pair step in the initial plotting. The user can also specify whether to show the labels of base residues and where to place the labels before clicking the 'Visualize' button. The labels can be placed inside the six-membered ring of each base or next to the C8 atom of purine (R) bases and the C6 atom of pyrimidine (Y) bases.
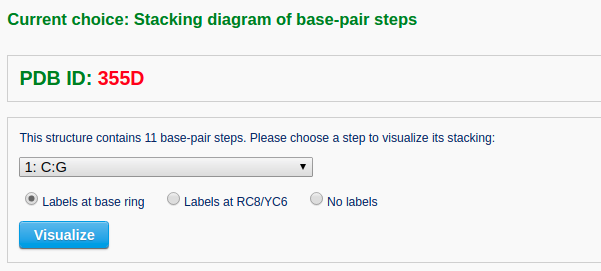
The user may need to wait a few minutes for the calculation of all the stacking images of a long piece of DNA, such as that on the nucleosome. After viewing the stacking diagram of the selected base pairs, the user can navigate to other steps along the structure by clicking the “Previous step” and “Next step” buttons.
A 3D interactive visualization of the associated base pairs is also shown.