Web 3DNA 2.0 for the analysis, visualization, and modeling of 3D nucleic acid structures |
You will be automatically redirected to the new wDSSR Server in 9 seconds.
Tutorials
| Analysis | Visualization | Rebuilding | Composite | Fiber | Mutation |
The analysis component of Web 3DNA 2.0 determines a wide range of conformational parameters — such as the rigid-body parameters of interacting nucleic-acid bases, base-pair steps of spatially adjacent base pairs, torsion angles of main chain and side groups, etc. — from a user-provided PDB/NDB ID (the structure identifiers used respectively in the Protein Data Bank and the Nucleic Acid Database) or a PDB-formatted file. The output files can be downloaded or viewed directly on a results page. Selected base-pairing, base-pair step, and torsion angle data are reported in interactive tables.
Example 1-1: Analyze a nucleic-acid-containing structure by using the PDB/NDB ID
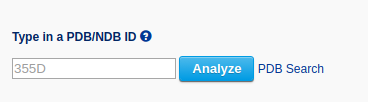
Before conducting an analysis on the web server, users are encouraged to verify the PDB/NDB ID of the input structure at the PDB or NDB website and gain some familiarity with the structure. To use the analysis component, the user can enter a valid PDB/NDB ID in the input area, for example "355D".
After clicking the 'Analyze' button, the user is directed to a results page containing five sections: 1. Structural summary, 2. Block Representations, 3. Interactive 3D view, 4. Output files of derived structural parameters, and 5. Interactive tables.
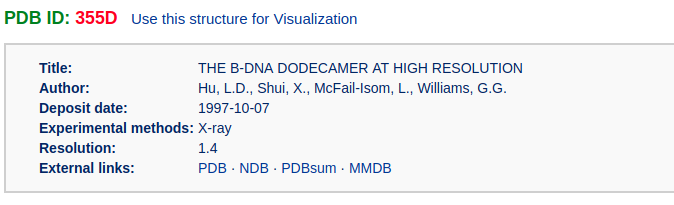
This section briefly describes the structure title, the author(s), the deposition date, the experimental method used to determine the structure, the resolution (for X-ray and EM structures), and any external links related to the structure. If the input file is an NMR structure, the number of models in the structure will be counted and reported (see Example 1-2 for the analysis of a multi-model structure).
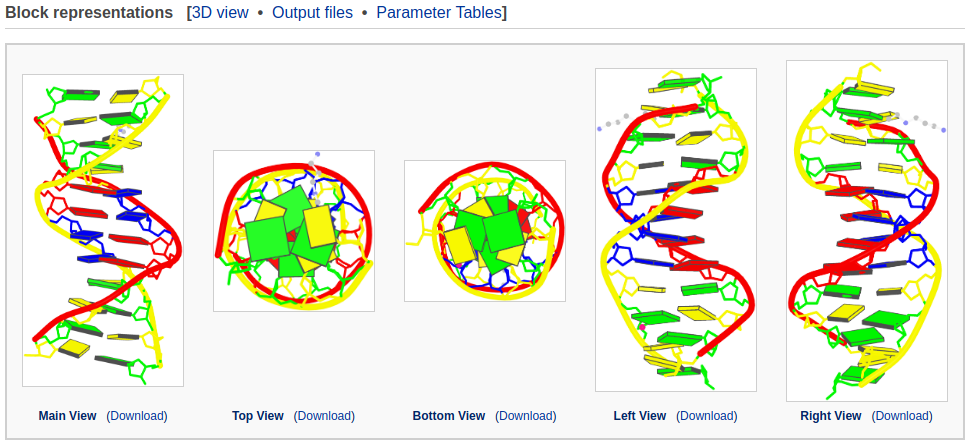
These figures are drawn with schematic block representations of the bases, tube representations of the strands, and atomic representations of the sugar-phosphate-backbones. Proteins (if any) are represented by violet ribbons, and small molecules by ball-and-stick images. The same representations are also used in the PDB and NDB websites. The image is enlarged when the mouse is hovered over a specific image.
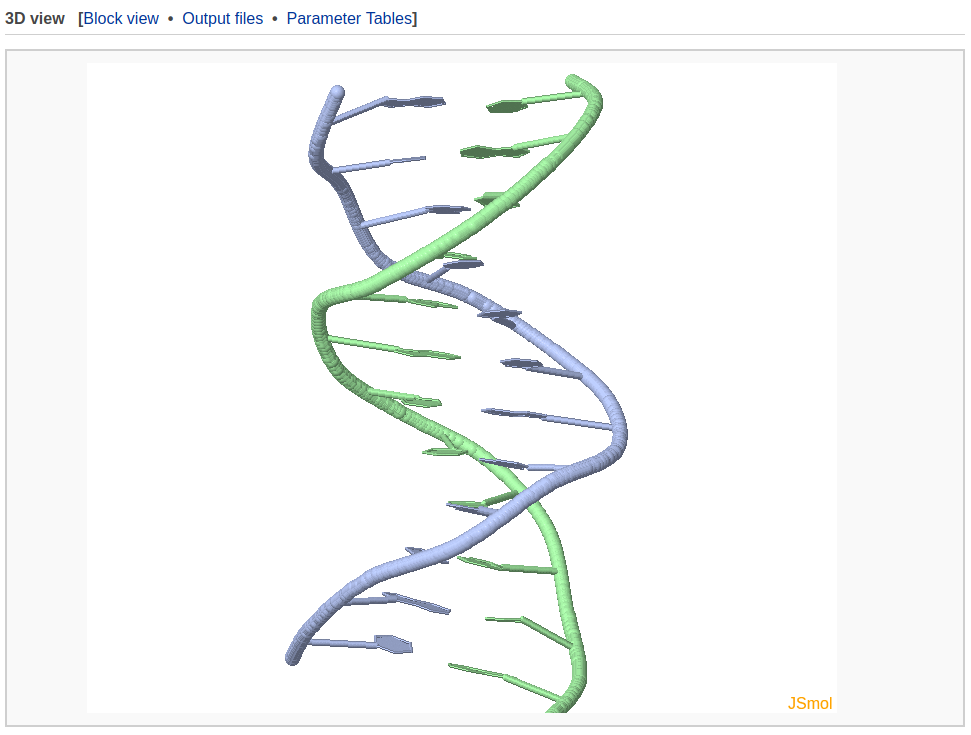
A 3D interactive visualization of the input structure is presented in this section. The user can click the "JSmol" label on the lower right-hand corner to choose more options provided by JSmol.
4. Output files of derived structural parameters
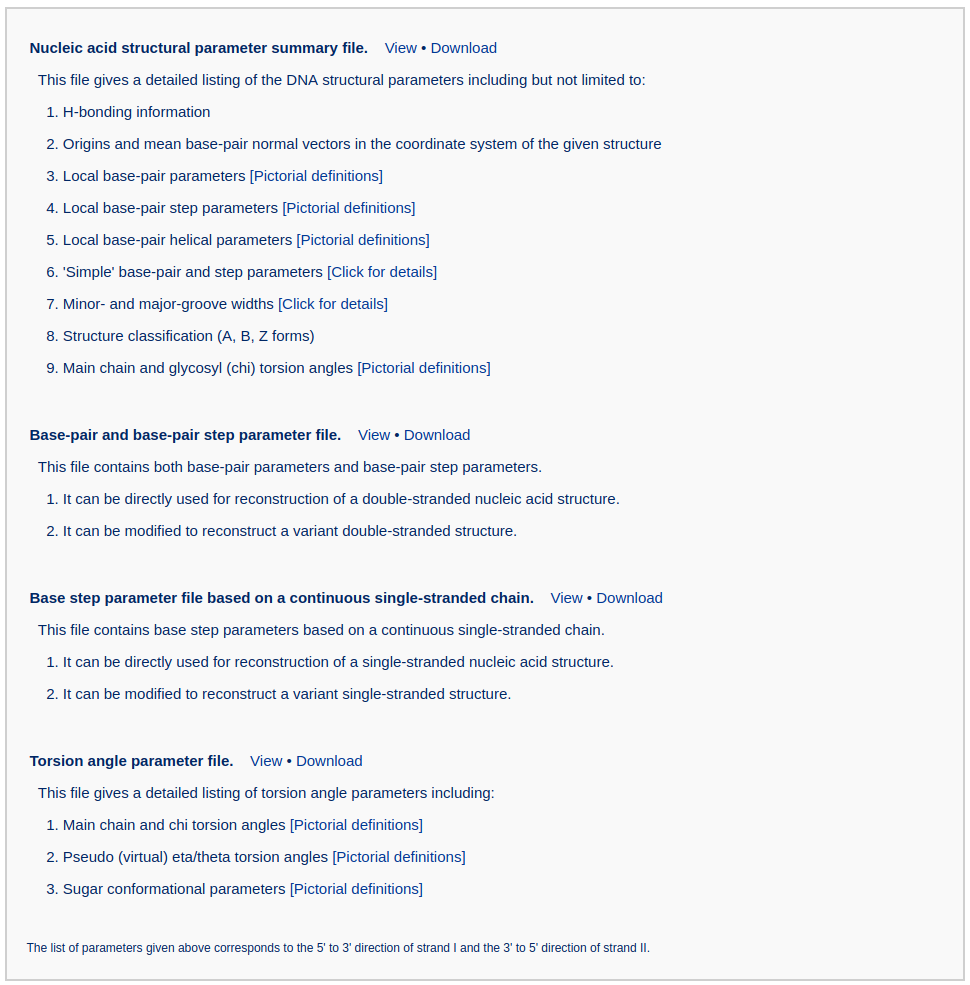
This section includes four derived parameter files: the summary file, the base-pair and base-pair step parameter file, the 'single-stranded' step parameter file and the torsion angle parameter file. Each file can be viewed on the web page or downloaded.
5. Interactive tables (one of them shown here)
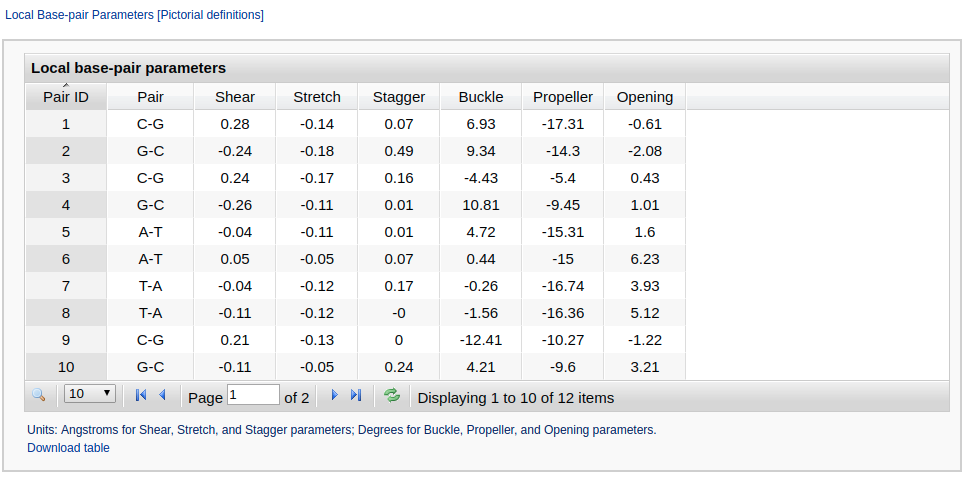
This section contains nine interactive tables embracing rigid-body parameters of base pairs and base-pair steps as well as torsion angles. Users can control the number of rows displayed on each page with a limit of 100 entries per page. Data in the table can be sorted by clicking the column headers. Each table can be downloaded in CSV format for further processing. The angles are expressed in degrees and the distances in Angstrom units.
Example 1-2: Analyze a multi-model structure
If the input PDB/NDB ID represents a structure with multiple models (for example the NMR structure "1HRZ"), the results page will contain extra information and options in the Structural summary section (see the following figure).
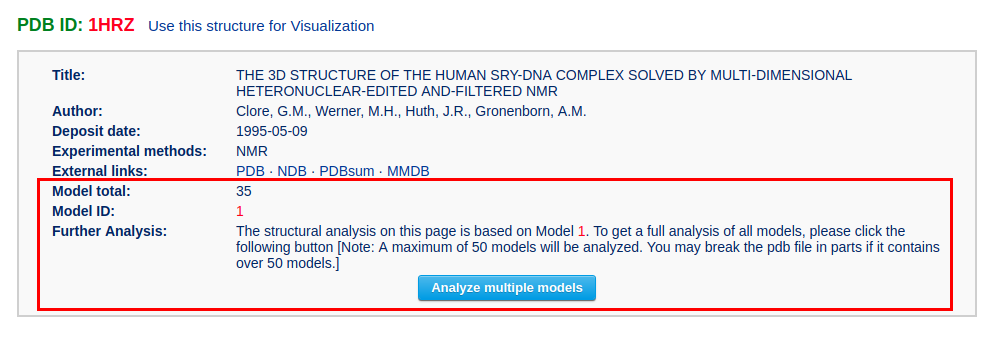
The user can click the "Analyze multiple models" button to go to a multi-model analysis results page. It should be noted that a maximum of 50 models will be analyzed. If the ensemble has more than 50 models, only the first 50 models will be analyzed. The user should modify the input file to analyze additional models, 50 at a time.
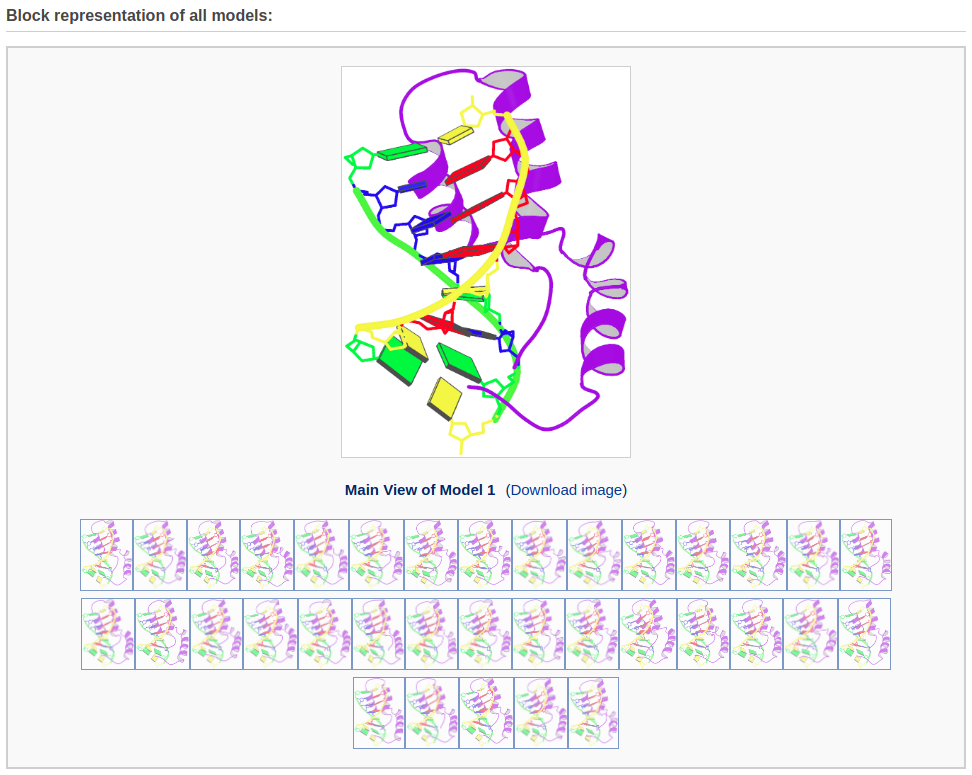
The multi-model results page contains block representaions of all models (50 maximum). The user can move the mouse over the small icons at the bottom to display a magnified view of the fluctuations among the models. The user can download each of the images by clicking the corresponding links.
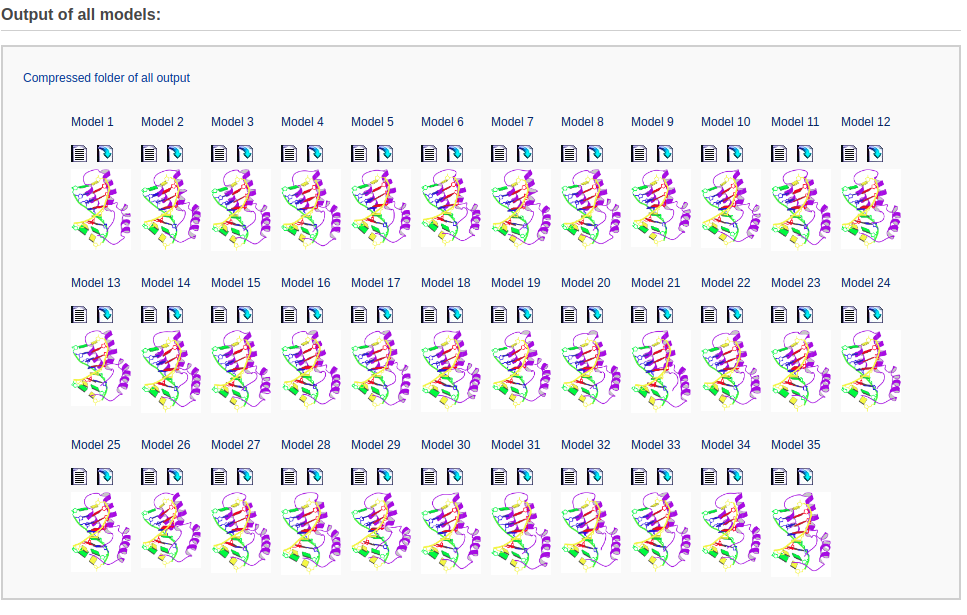
This section includes structural parameter and image files of all the models. The user can directly view the parameter file for each model and a download link is also provided. For the convenience of users, a compressed folder including all the output files in '.tar.gz' format is offered for downloading.
Example 1-3: Analyze a nucleic-acid-containing structure by uploading the PDB-formatted file
The user can also upload a structural file, including a multi-model file, in PDB format for analysis.
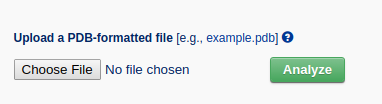
After clicking the 'Analyze' button, the user is redirected to a results page that is similar to Example 1-1, but without the Brief Description section.